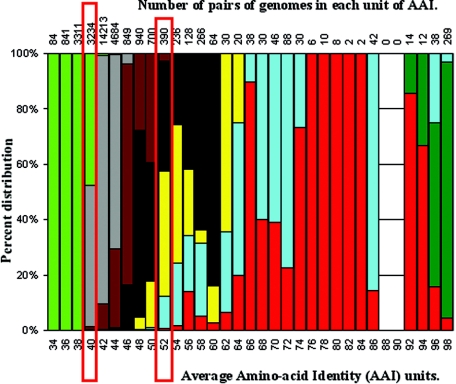
FIG. 4.
In-depth calculation of the extent of AAI overlap between the ranks of taxonomy. We determined the number of pairs of genomes (top; x axis) related at any given unit of AAI (bottom; x axis), as well as the smallest taxonomic rank that each pair of genomes shares. The bars show the percent distribution (or overlap) of the taxonomic ranks for each unit of AAI (for an example related to the bars outlined in red, see the text). The color representation of the ranks is identical to that of Fig. 3.

