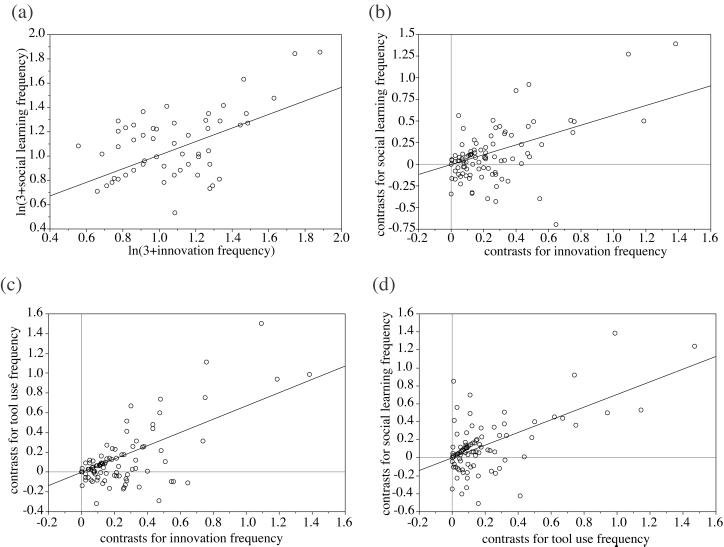
Figure 2.
(a and b) Innovation and social learning frequencies, corrected for research effort, covary. (a) The raw data, with each point representing one species (r = 0.48, F1,114 = 108.38, P < 0.0001). (b) Independent contrast data (r
 = 0.35, F1,100 = 55.47, P < 0.0001). (c and d) Innovation and tool use (c; r
 = 0.54, F1,100 = 118.89, P < 0.0001) and social learning and tool use frequencies (d; r
 = 0.45, F1,100 = 84.65, P < 0.0001), corrected for research effort, covary. Both c and d show independent contrast data.

