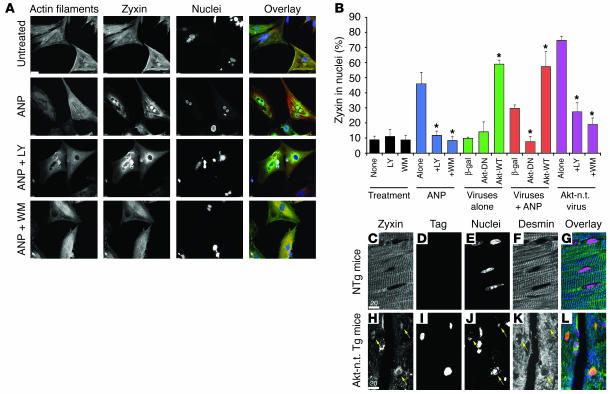
Figure 11.
Nuclear-targeting of activated Akt induces nuclear accumulation of zyxin, and inhibition of Akt activation impairs nuclear accumulation of zyxin. Consequences of inhibiting Akt activation for zyxin nuclear localization (A and B) and Akt-mediated effects upon localization of zyxin in vivo (C–L). (A) Confocal micrographs of cultured cardiomyocytes treated with ANP alone or ANP following prior inhibitor treatments of LY294002 (LY) or wortmannin (WM). Distribution of zyxin (green in overlay) was influenced in all 3 groups, but inhibitor treatments prevented nuclear accumulation of zyxin. Nuclei were labeled with TOPRO (blue in overlay), and phalloidin shows actin filament structure (red). Scale bar: 10 μm (all scans in A at identical scale). (B) Bar graph shows the percentage of cells possessing nuclear localized zyxin following treatment with ANP (10–9 M) as assessed by confocal microscopy. Treatment groups from left to right are: no treatment with pharmacologic inhibitors; ANP treatment with or without pharmacologic inhibitors; adenoviral infections without ANP treatment; adenoviral infections with ANP treatment; and nuclear-targeted Akt (Akt-n.t.) adenoviral infection with and without pharmacologic inhibitors. *P < 0.005 relative to the control (first bar of each group) was found as indicated. Myocardial sections (C–L) show nuclear accumulation of zyxin in transgenic mice expressing cardiac-specific nuclear-targeted Akt (Akt-n.t. Tg) but not in nontransgenic control samples. Arrows indicate nuclei positive for both zyxin and Akt-n.t. Transgenic Akt-n.t. was visualized using antibody to myc-tag (tag) and desmin to show myofibrillar structure. Arrows indicate nuclei positive for both Akt-n.t. and zyxin. Nuclei were shown to correlate with Akt-n.t. labeling but are not included in overlay to facilitate presentation. Overlay colors correspond to Akt-n.t. (red), zyxin (green), and desmin (blue) with coincidence of red and blue labeling appearing yellow. Scale bars: 20 μm (C–L).

