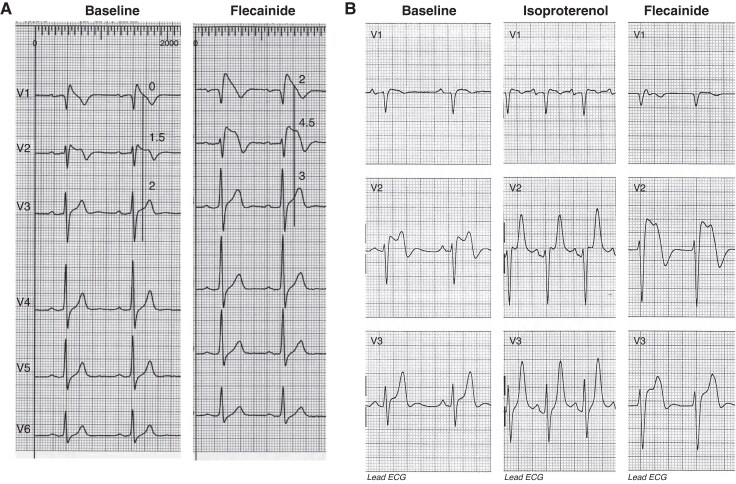
Figure 20.
Electrocardiogram (ECG) tracings of leads V1–V6 (A) and V1–V3 (B) illustrating the dynamic changes in two patients with Brugada syndrome at baseline, during isoproterenol infusion, and following i.v. administration of flecainide (2 mg/kg). (A) Baseline ECG shows mild ST-segment elevation (1.5 mm) in V2, measured at 80 ms from the J point. Following flecainide infusion, ST-segment elevation increases significantly to 4.5 mm. (B) In another patient, baseline ECG reveals ST elevation and T-wave inversion in V2. These abnormalities normalize during isoproterenol infusion but are markedly exaggerated following flecainide administration. The ECG was recorded at a speed of 25 mm/s and a sensitivity of 10 mm/mV.

