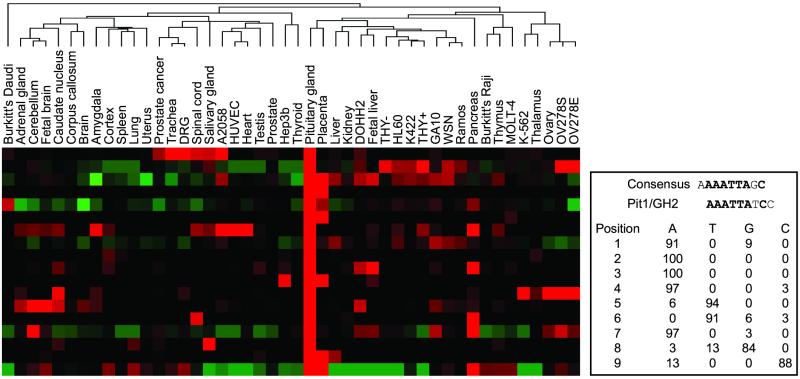
Figure 3.
Identification of pituitary-specific response elements. The gene expression atlas was used to identify pituitary-enriched genes (Left). Genomic sequence up to 5 kb upstream of the translational start methionine was searched for conserved motifs. On the Right is a potential regulatory element identified in the upstream genomic sequence of the genes in this cluster. This element is similar to a previously described Pit1 binding site from the growth hormone 2 structural gene.

