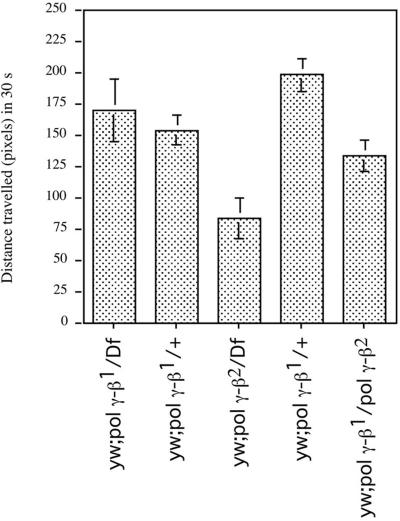
Figure 5.
Genetic analysis of larval locomotion. Mean distance traveled in 30 s on an agar surface under safelight conditions. The following statistical comparisons were made with Mann–Whitney U tests at a 95% confidence interval: pol γ-β1/Df(2L)b80c1 (n = 14) vs. pol γ-β2/Df(2L)b80c1 (n = 19), test statistic (W) = 315.0, P = 0.0053; pol γ-β2/+ (n = 26) vs. pol γ-β2/Df(2L)b80c1 (n = 19), test statistic (W) = 254.0, P < 0.001; pol γ-β2/Df(2L)b80c1 (n = 19) vs. pol γ-β1/pol γ-β2 (n = 14), test statistic (W) = 261.5, P = 0.0263.

