Figure 3.
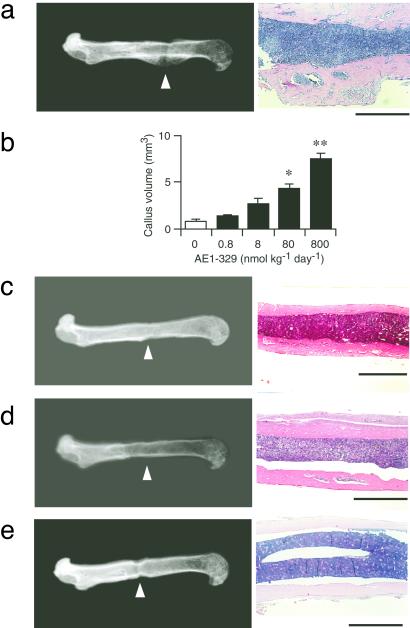
Selective induction of bone formation by an EP4 agonist. Radiograph and histology of the femora treated with either the EP4 agonist AE1–329 (a), EP1 agonist DI-004 (c), EP2 agonist AE1–259 (d), or EP3 agonist AE-248 (e) are shown. Typical findings with a dose of 800 nmol/kg per day are shown. (Bars = 1 mm.) In b, the dose dependence of the effects of AE1–329 is shown. Data are from four animals per each dose. *, P < 0.01; **, P < 0.001 vs. vehicle-treated control.

