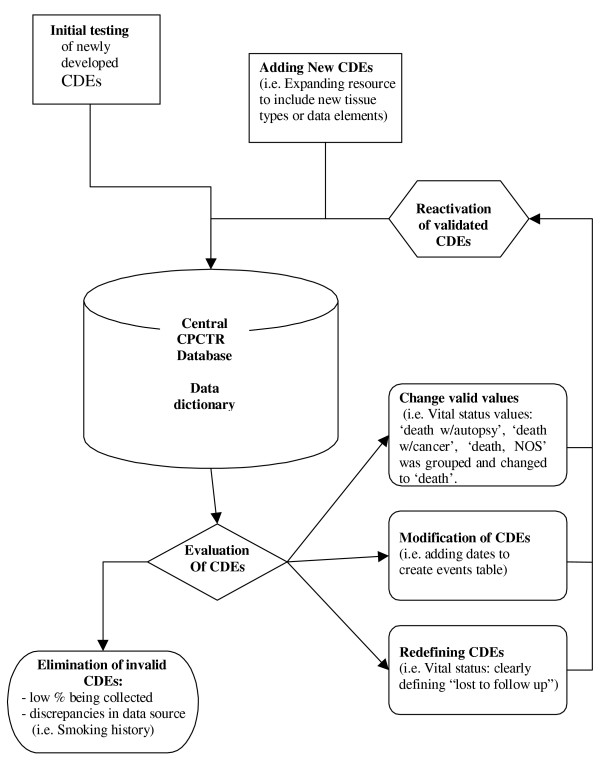
Figure 5.

Re-Evaluation of CDEs. The flow chart describes the re-evaluation process involved for validating the CDEs. Any changes made after this process, usually eliminates discrepancies and difficulties with the data collection process. In addition, the database also shows an increase in number of fields being populated with valid values and a decrease in "unknown" values.
