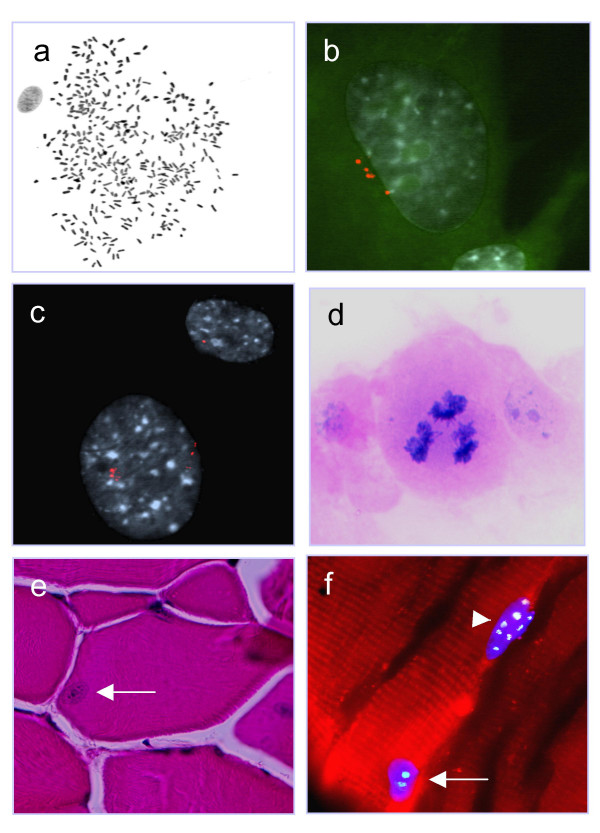
Figure 1.
Cytogenetic and immunofluorescent analysis. G-banded polyploid metaphase cell from wt31 abdominal muscle (a). Multiple centrosomes (red) in cells from the peritoneal fat of R6/2 78 (b; green autofluorescence indicates cytoplasm) and from the abdominal muscle of wt77 (c; autofluorescence removed for clarity). Tripolar anaphase cell visualized by haematoxylin-eosin staining in a cell (passage 1) from the abdominal muscle of wt30 (d). Large nucleus (arrow) in a skeletal muscle fibre from wt77 (e). One nucleus with two chromocenters (arrow; green) and one with eight chromocenters (arrowhead) in a skeletal muscle fibre from wt76 (f).

