
Figure 3.
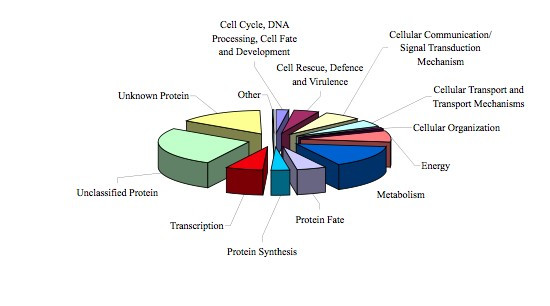
Functional classification of the AsCIUniGene Set. Classification was done both manually and according to the MATDB classification scheme (see Methods). The functional category is indicated by the text associated to respective piece in the diagram. The size of each piece is proportional to the relative abundance to the proteins assigned to this group.