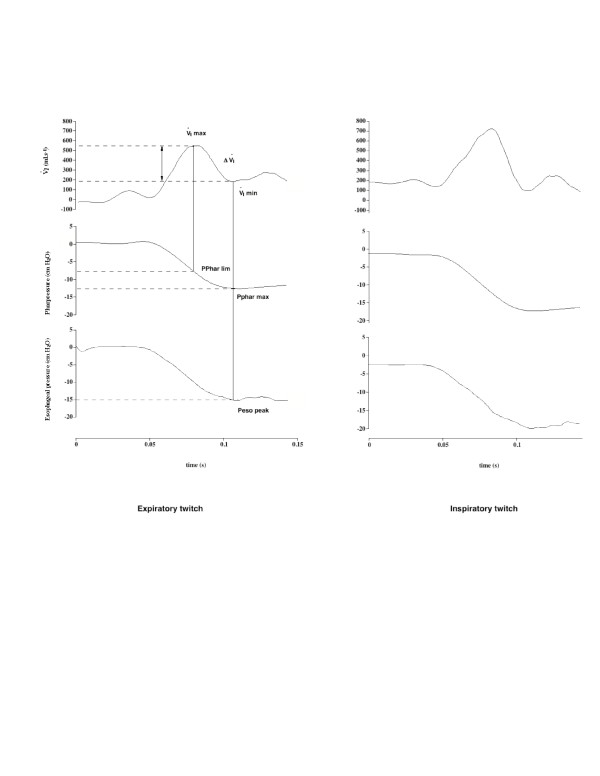
Figure 1.
Example of the changes in inspiratory flow and pharyngeal andesophageal pressures in response to PNS-induced diaphragm twitch applied during expiration and inspiration in a representative normal subject. Time 0 indicates the application of the twitch.  I max and
  I min stand respectively for the maximal and minimal flow values reached during the twitch. Pphar lim indicates the pharyngeal pressure value corresponding to
  Imax. Peso peak indicates the driving pressure corresponding to
  I min. See text for abbreviations.

