
Figure 2.
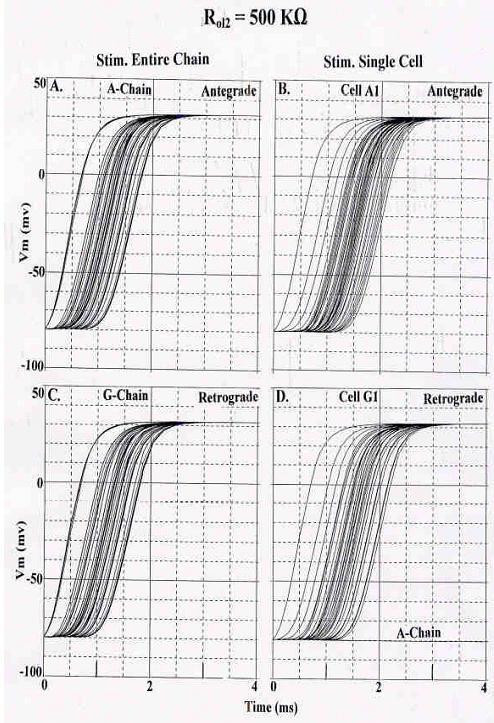
Rising phases of the simulated APs recorded from the 7 × 7 model for cardiac muscle when Rol2 was 500 KΩ. A-B: Antegrade propagation. A: Stimulation of the entire A chain. No chains failed, and TPT was short. Many traces overlap. B: Stimulation of only cell A1. Again, there were no failures. TPT was prolonged (compare to Panel A). C-D: Retrograde propagation. C: Stimulation of entire G-chain. No failures occurred. TPT was about the same as in panel A (for orthodromic). D: Stimulation of only cell G1. The last chain (A) failed.