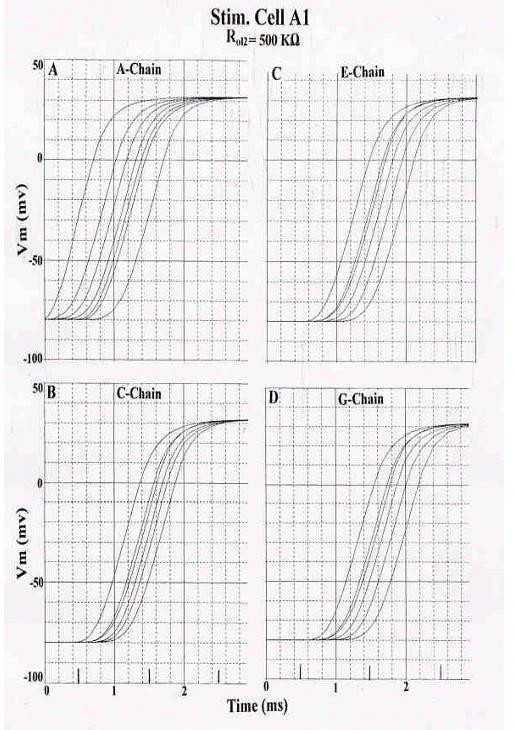
Figure 3.

Recordings of the APs from one chain at a time, so that the transverse spread of excitation can be more clearly seen. 7 × 7 model of cardiac muscle. Standard conditions for all circuit parameters; Rol2 was 500 KΩ. Stimulation was applied to cell A1 (first cell of A-chain). All 49 cells responded. To reduce the number of panels, records from every other chain are illustrated. A: Records from the A- chain. B: Records from the C- chain. C: Records from the E- chain. D: Records from the G- chain. As can be seen, the stimulated A-chain responded earlier, followed by C-, E-, and G-chains. But there was some overlap between the traces from the various chains, indicating that transverse propagation between chains occurs simultaneously with longitudinal propagation within each chain.
