Figure 4.

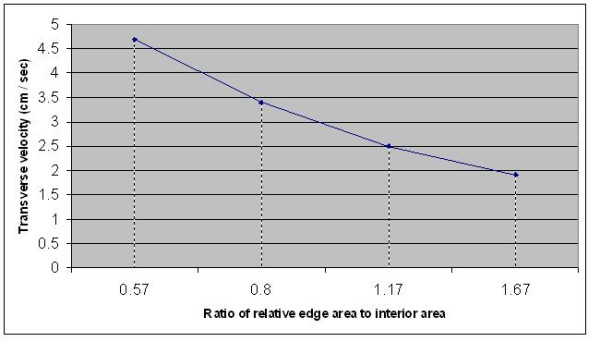
Plot of transverse velocity of propagation of the simulated cardiac action potentials as a function of the ratio of relative edge area to interior area (see Table 2).

Plot of transverse velocity of propagation of the simulated cardiac action potentials as a function of the ratio of relative edge area to interior area (see Table 2).