
Fig. 3.
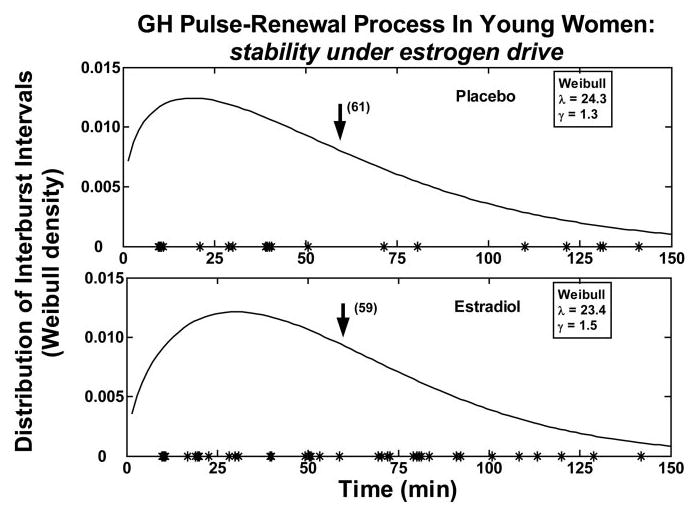
Probability distribution of GH intersecretory-burst intervals determined after saline infusion in a midphysiological (E2) and postmenopausal (Pl) estrogenic milieu. Values on the y-axis give the expectation of observing any given GH interpulse-interval length (x-axis). The mathematical terms lambda and gamma stated within the two boxes denote, respectively, mean pulse frequency (number of bursts per 24 h) and the relative variability of interpulse intervals (gamma > 1.0 signifies lesser variability than that of a Poisson model, wherein the CV is 100% definitionally) (see Subjects and Methods). Asterisks on the axes mark the onset of significant pulses.