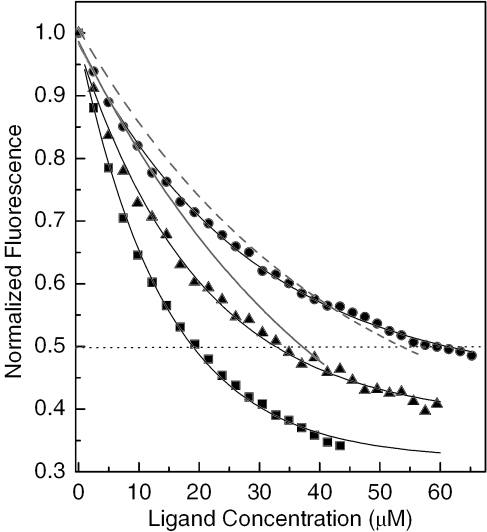
Figure 2.
DNA-ethidium fluorescence monitored at 603 nm in the presence of varying concentrations of intercalating agents (numbers in parentheses are C50 [µM] values). Squares: PT-BIS(ACRAMTU)/poly(dA-dT)2 (17.72); triangles: PT-BIS(ACRAMTU)/calf thymus DNA (32.65); circles: PT-BIS(ACRAMTU)/poly(dG-dC)2 (65.14); solid line: ACRAMTU/poly(dA-dT)2 (40.54); dashed line: ACRAMTU/poly(dG-dC)2 (53.57). For clarity, only the fitted curves are shown for ACRAMTU.

