
Fig 8. Regulation of IkBα mRNA expression.
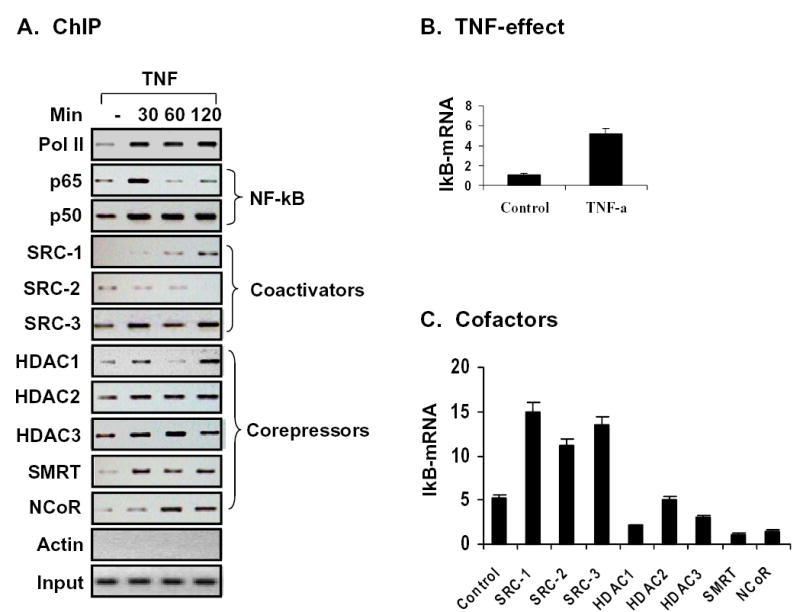
(A) The ChIP assay was conducted as stated in the method section. To help readers in understanding the complex switches among the coactivators and corepressors, and between the coactivator and corepressors, ChIP data presented in Figures 1 through 7 are combined together here. (B) IkBα mRNA expression was induced by TNF-treatment in 293 cells. IkBα mRNA was determined by Taqman RT-PCR as stated in methods. (C) Regulation of IkBα mRNA by the coactivators and corepressors.