
Figure 2.
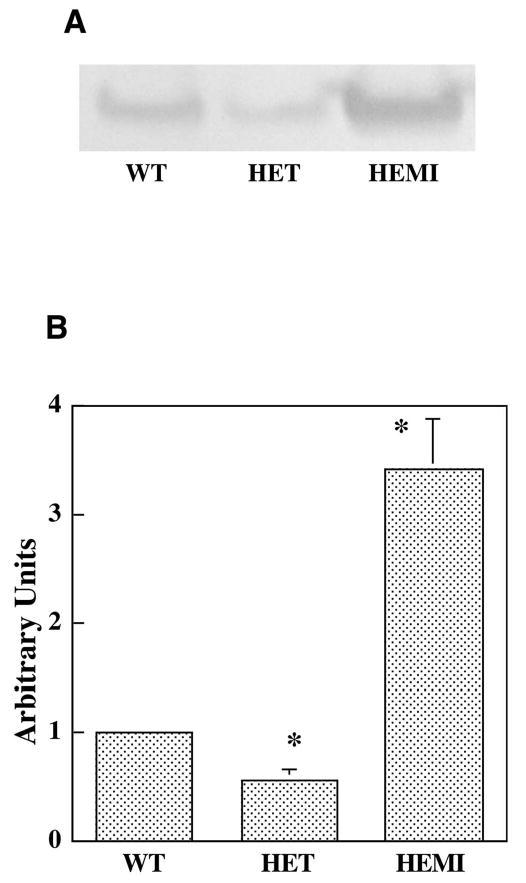
Differential expression of SOD2 in RPE cells. (A) Extracts containing 10 μg protein from each of the cell cultures were subjected to SDS-PAGE followed by Western-blot analysis with antibody to SOD2. (B) The enzyme level was quantified by integrated density scanning of the immunoblot membrane. The relative SOD2 levels in WT, HET, and HEMI mice were 1.0, 0.6, and 3.4, respectively. Data are expressed as the mean ± SEM (n = 4). *P < 0.05 compared with those of WT.