


Figure 6.
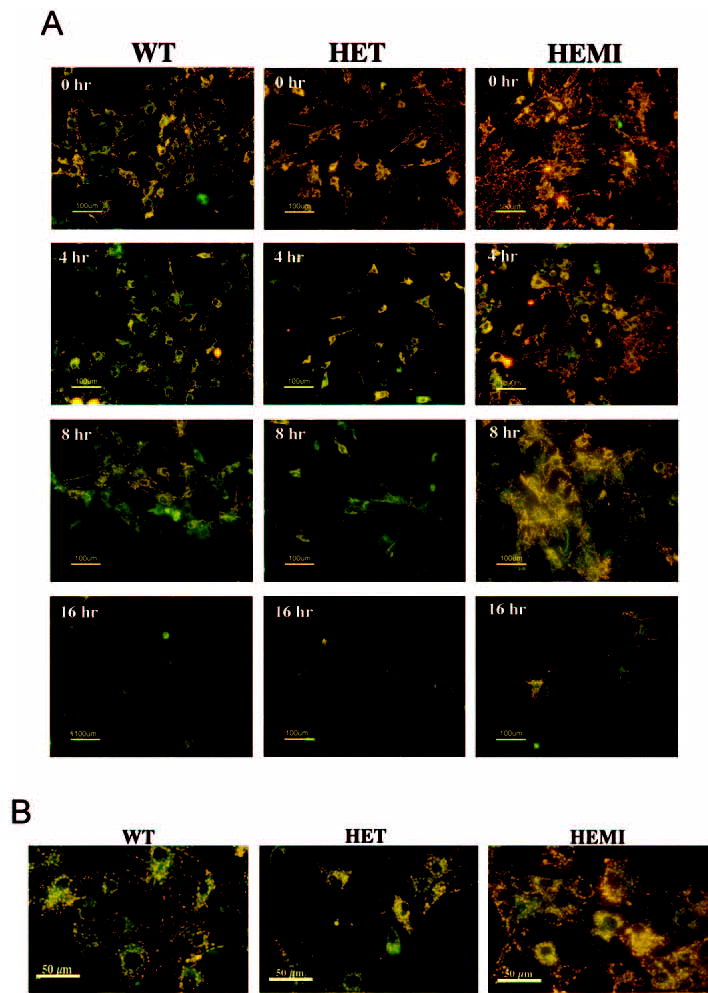
Effect of H2O2 on mitochondrial transmembrane potential in RPE cells with various levels of SOD2. (A) An equal number of cells from each of the cultures were exposed to 300 μM of H2O2 for 1 hour and then recultured for 4, 8, and 16 hours in normal medium. The cells were then treated with a cationic dye and observed under a fluorescence microscope. The decreased fluorescence (orange) began to appear at 4 hours in the WT and HET cells, indicative of the dispersion of MTP. This was more marked in cells from the HET mice than in those from the WT and HEMI mice. The images are representative of one experiment after 4, 8, and 16 hours of reculture in three separate experiments. (B) Higher magnification of the stained cells with exposure to 300 μM of H2O2 for 1 hour and reculture for 4 hours.