
Figure 7.
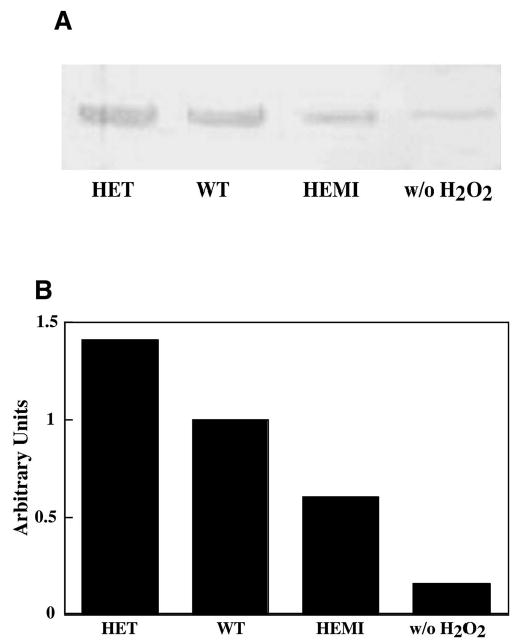
Effect of H2O2 on cytochrome c leakage from mitochondria in RPE cells with various levels of SOD2. Cells from each of the cultures were exposed to 300 μM of H2O2 for 1 hour and then recultured for 8 hours in normal medium. (A) Cytosolic fractions containing 10 μg protein were subjected to SDS-PAGE followed by Western-blot analysis with antibody to cytochrome c. (B) The enzyme level was quantified by integrated density scanning of the immunoblot membrane. The relative levels of cytochrome c in the cytosol from RPE derived from the HET, WT, and HEMI mice were 1.4, 1.0, and 0.6 respectively.