
Fig. 2.
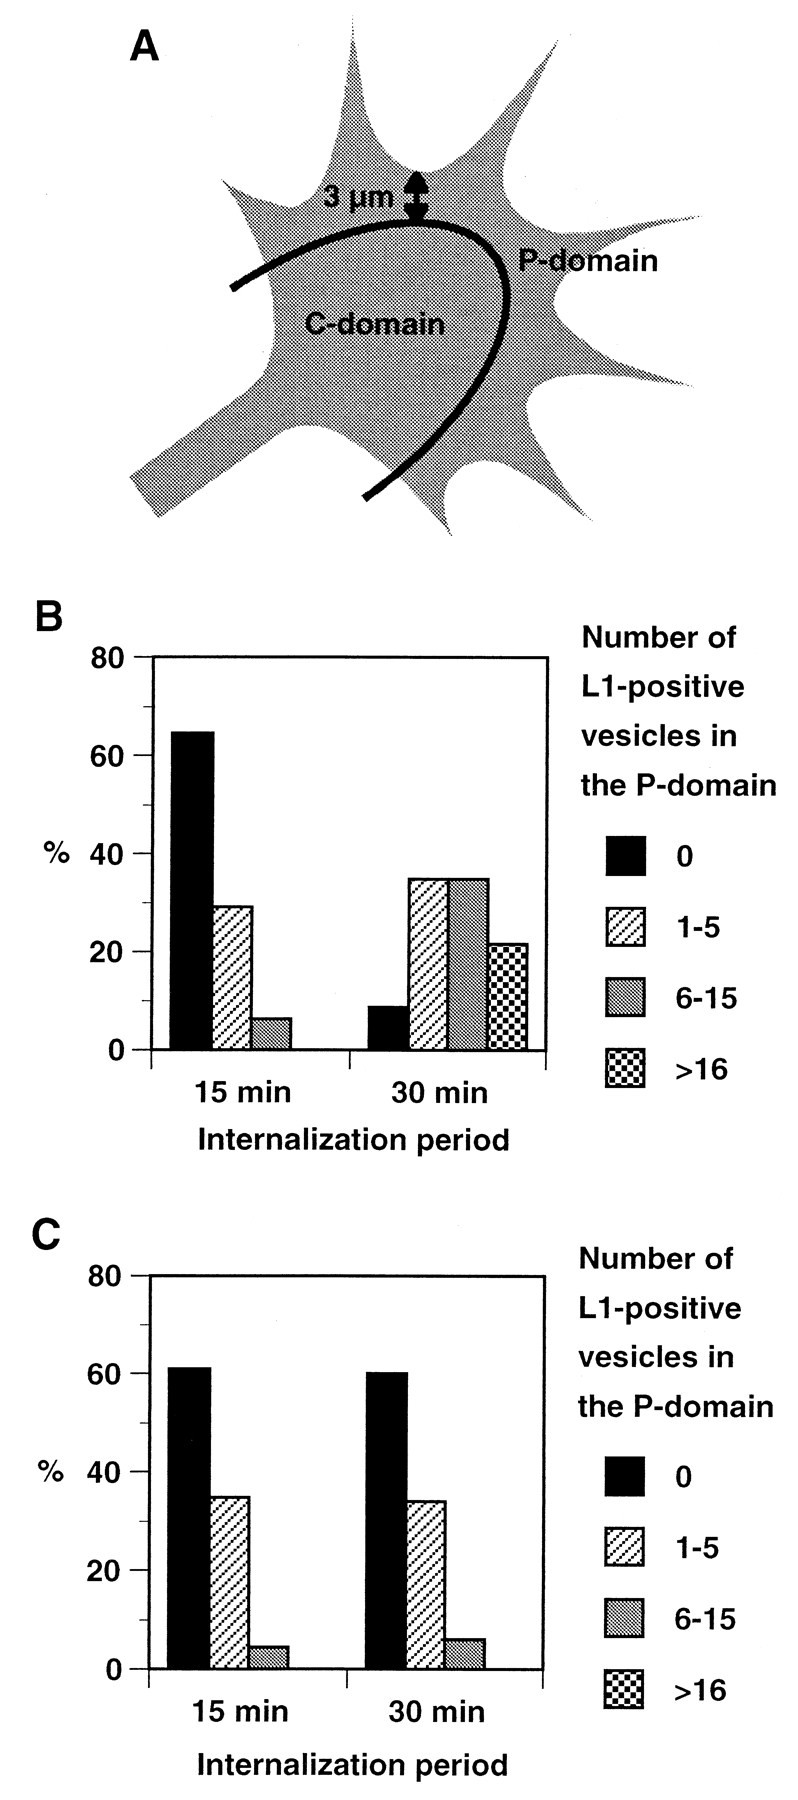
A, Schematic representation of the growth cone showing the P- and C-domains. For analyses of distribution patterns of endocytosed L1, the P-domain was defined as the area consisting of the filopodia and the lamellar regions within 3 μm of the leading edge based on Schmidt et al. (1995). B, Changes of distribution of endocytosed L1 over time in growth cones migrating on L1. Endocytosed L1 was visualized as shown in Figure 1, and the number of L1-positive endocytic organelles in the P-domain was categorized into four groups. Shown are the percentages of growth cones in each group at the 15 min (n = 48) and 30 min (n = 46) time points. There was a statistically significant difference between the two time points (p < 0.0001). C, Changes of distribution of endocytosed L1 over time in growth cones migrating on laminin. Shown are the percentages of growth cones in each group at the 15 min (n = 46) and 30 min (n = 50) time points.