


Fig. 2.
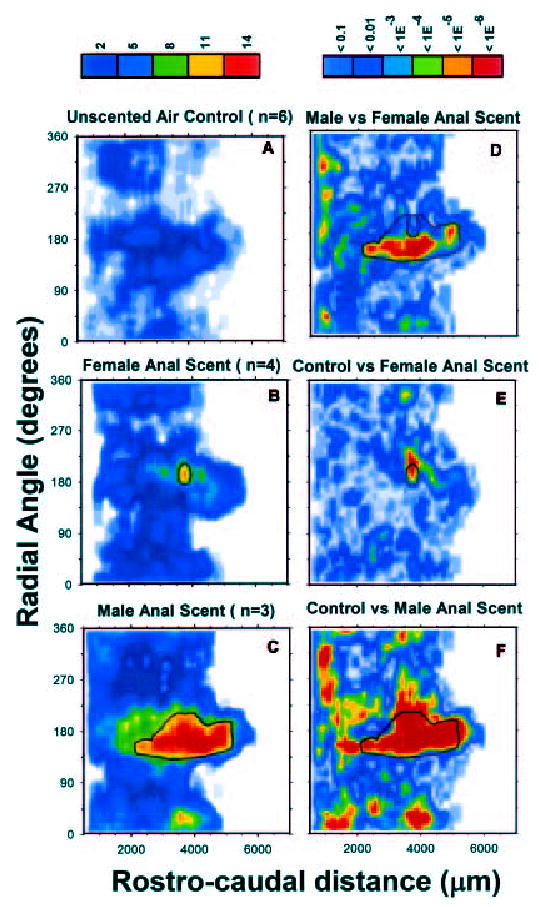
Patterns of glomerular activation in the MOB of gonadally intact, oestrous female ferrets after exposure to male vs. female anal scents. Data are plotted in bins defined by radial angle and rostro-caudal distance through the olfactory bulb. (A–C) The average number of activated glomeruli per bin after exposure to unscented air (A), female anal scent (B) or male anal scent (C); scale above the left column indicates the number of activated glomeruli per bin. No activated glomeruli were seen in white areas. (D–F) P-values from bin-wise Mann–Whitney U-tests comparing differences between female vs. male anal scent (D), control vs. female anal scent (E) and control vs. male anal scent (F). The scale above the right column indicates P-values; P ≤ 1 × 10⁻⁵ was significantly different after Bonferroni correction. The black outlines in B and C indicate the areas of maximal activation in response to female and male anal scent, respectively. These black outlines are superimposed on the Mann–Whitney U-plots (D–F) and indicate whether areas of maximal activation were significantly different between groups.