
Fig. 1. UV-visible spectra of 15 μm RumA, and in the presence of varying concentrations of ferricyanide.
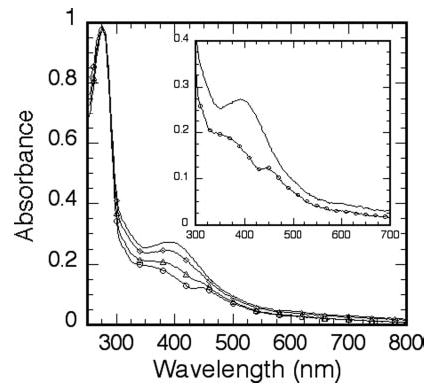
Ferricyanide concentrations shown are 0 μm (no symbol), 60 μm (⋄), 120 μm (Δ), and 180 μm (○). Inset, expansion of the spectra in the absence and presence of 180 μm ferricyanide.