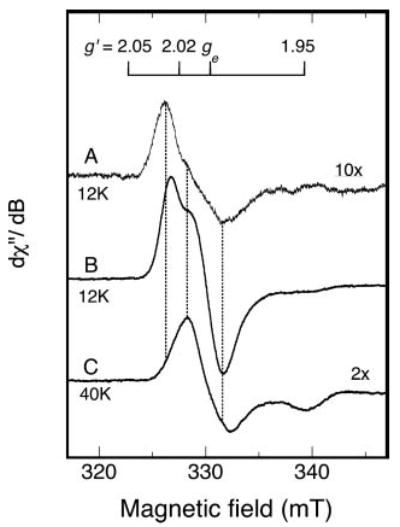
Fig. 3. EPR spectra (9.26 GHz) of oxidized RumA at two temperatures.

A, spectrum (12 K) of aerobically isolated RumA (0.4 mm); B, spectrum (12 K) of ferricyanide-oxidized RumA (0.35 mm RumA, 0.37 mm potassium ferricyanide); C, higher temperature spectrum (40 K) of the same oxidized RumA sample as in B. Instrument parameters were the same as those listed in the legend to Fig. 2 except the time constant was 0.25 s. Spectrum B was recorded at a receiver gain of 2000 and the amplitudes of spectra A and C, recorded with different gains (6,300 and 12,500 respectively), were adjusted to a gain of 2,000 and then multiplied by the factors indicated on the figure for visual comparison. The vertical dotted lines show alignment of maxima and minima, and are positioned at g′ values of 2.028, 2.016, and 1.995. The free electron g value, ge, is a constant.
