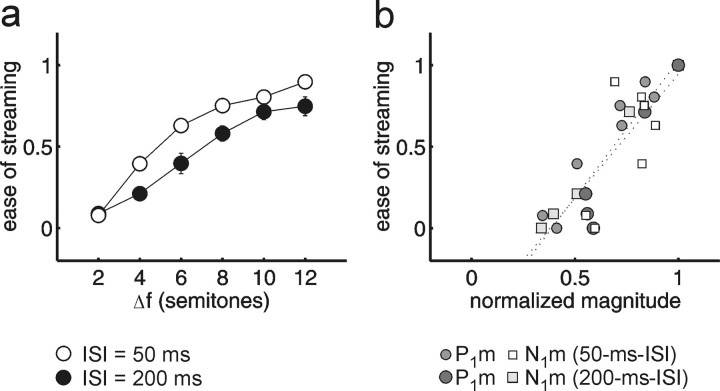
Figure 3.
Stream segregation as a function of frequency difference and ISI: behavioral versus MEG data. a, Listeners rated the ease of holding to the two-stream perception (0, impossible; 1, very easy). The graph shows mean values ± SEs (n = 13; error bars are shown only if they exceed the size of the symbol). Comparison of the 50 ms ISI (open circles) with the 200 ms ISI condition (filled circles) reveals the well-known effect that larger frequency separations (Δf) are required for stream segregation as the tempo decreases. b, Perceptual stream segregation plotted against the normalized magnitude of P1m (circles) and N1m (squares) in the same listeners (n = 13). The data points of the 200 ms ISI condition are plotted in a darker shading than those of the 50 ms ISI. Regression lines (dotted lines) were fitted for each peak separately.

