
Fig. 6. Ezrin activation after initiation of Na+-glucose cotransport requires Akt2 expression.
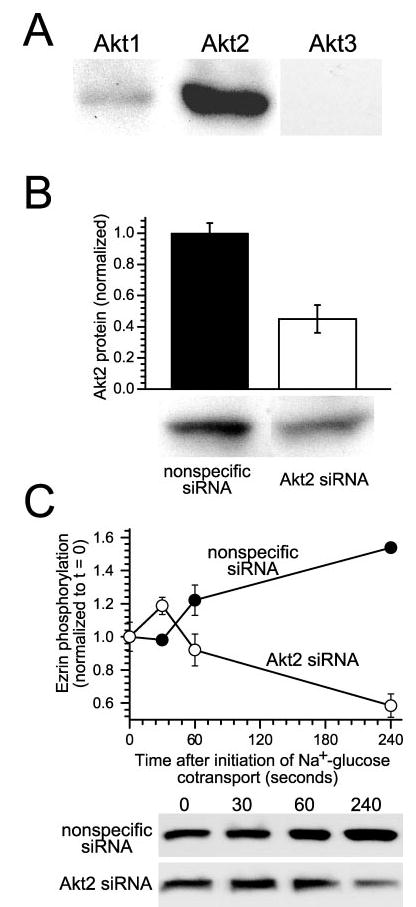
A, Caco-2 intestinal epithelial cells primarily express Akt2. To determine which Akt isoforms are expressed in intestinal epithelia, confluent monolayers were lysed and immunoblotted using isoform-specific antisera. Both Akt1 and 2 are present, but Akt2 is the predominant isoform expressed in intestinal epithelial cells. Akt1 was detected only weakly. No signal was detected in immunoblots using anti-Akt3 antibodies. Results are typical of three independent experiments, each with duplicate samples. B, Akt2 protein expression can be specifically knocked down using siRNA. Treatment of monolayers with Akt2-specific siRNA resulted in knockdown of protein levels by 55 ± 9% relative to control monolayers transfected with nonspecific siRNA (p < 0.05). Expression of Akt1, ezrin, NHE3, and actin was not changed by either specific or nonspecific siRNA (data not shown). Results are typical of five independent experiments, each with triplicate samples. C, knockdown of Akt2 expression in intact cells blocks ezrin phosphorylation after initiation of Na+-glucose cotransport. Monolayers transfected with either nonspecific siRNA (black circles) or Akt2-specific siRNA (white circles) were lysed at indicated timepoints after initiation of Na+-glucose cotransport. After 240 s, ezrin phosphorylation fell by 42 ± 5% in monolayers with knocked down Akt2 expression (white circles), whereas ezrin phosphorylation increased by 154 ± 4% in monolayers transfected with nonspecific siRNA (black circles; p < 0.05). Results are typical of three independent experiments, each with triplicate samples.