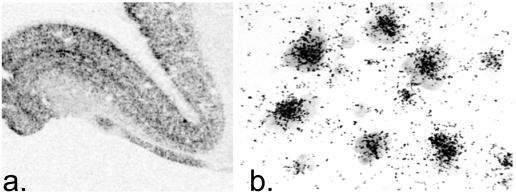
Figure 4.
Autoradiogram (a) and low-power photomicrograph (b) illustrating the expression of apo L1 transcripts in the prefrontal cortex of a control individual. Apo L1 transcripts appear to be expressed in all neurons at high levels. The apo L2 gene also showed a neuronal distribution of expression (not shown).

