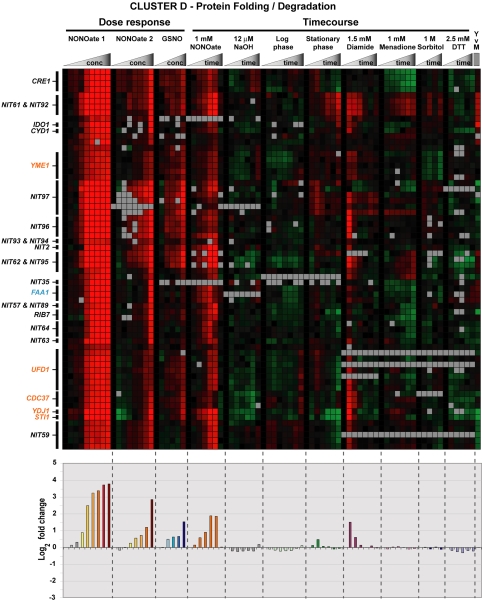
Figure 7.
Protein folding and degradation cluster. Cluster D from Figure 2 is expanded to show the characteristics of the protein folding and degradation cluster. Protein folding and degradation genes discussed in the text are highlighted in orange. The energy production gene FAA1 is highlighted in blue. The graph below the cluster diagram shows the average log2 fold change for all the genes in the cluster over each of the experimental conditions. In the DPTA NONOate and GSNO dose-response experiments, control treatments are represented by the gray bars.

