Figure 2.
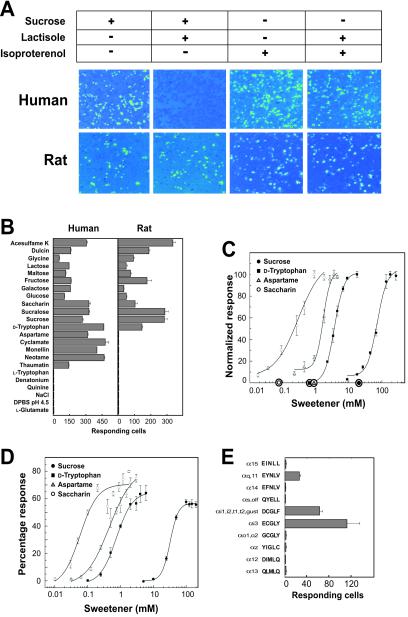
Human and rat T1R2/T1R3 recognize sweet taste stimuli. (A) Gα15 cells transiently transfected with human T1R2 and T1R3 and HEK-293T cells transiently transfected with rat T1R2, T1R3, and Gα15/i1 were assayed for intracellular calcium increases in response to 300 mM sucrose in the presence (+) and absence (−) of 1.25 mM lactisole and to 10 nM isoproterenol in the presence and absence of 1.25 mM lactisole. Each imaged field shown contains ≈1,000 confluent cells. (B) The responses of human T1R2/T1R3 and rat T1R2/T1R3 were determined for sweet taste stimuli at the concentrations listed in Materials and Methods. (C) Human T1R2/T1R3 dose responses were determined for sucrose, d-tryptophan, aspartame, and saccharin. Dose responses were normalized to the maximal percentage of responding cells, which ranged from 10 to 40% for different sweeteners. Values represent the mean ± SE of four independent responses. The x axis circles represent average psychophysical detection threshold values for these four sweeteners. (D) The dose responses of Gα15 cells stably transfected with human T1R2 and T1R3 were determined for sucrose, d-tryptophan, aspartame, and saccharin. Responses are shown as the percentage of fluorescence values relative to fluorescence increases elicited by 1 μM ionomycin. Values represent the mean ± SE of four independent responses. (E) HEK-293T cells were transiently transfected with rat T1R2, rat T1R3, and each Gα15 chimera, and assayed for intracellular calcium increases in response to 75 mM sucrose. The five C-terminal residues of each Gα15 chimera are shown. The activities in B and E represent the mean ± SE number of responding cells for four imaged fields of ≈1,000 confluent cells.

