
Figure 1.
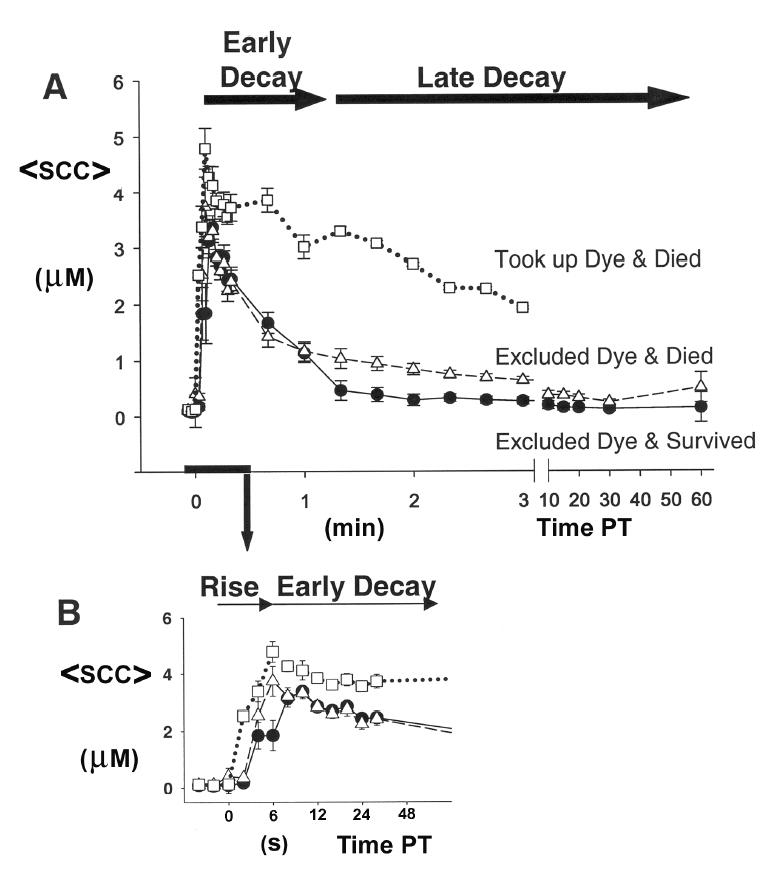
(A) Mean (±SE) somal [Ca2+] (<SCC>) before transection and posttransection (PT) of cells (n [cells] =37, N [cultures] =21; single neurite transection near the soma of each cell). (B) Expanded time scale for the first 0.5min (30s) PT of data shown in (A). Dye exclusion for each uniquely identified and tracked transected cell was assessed at 20min PT, and its survival assessed for up to 12h PT. Data are plotted for groups of cells that exhibited one of three possible outcomes: (1) excluded dye at 20min PT and survived at 12h PT (51%, filled circles), (2) excluded dye at 20min PT and died within 12hPT (30%, unfilled triangles), and (3) took up dye at 20min PT and died within 12hPT (19%, unfilled squares).