


Figure 2.
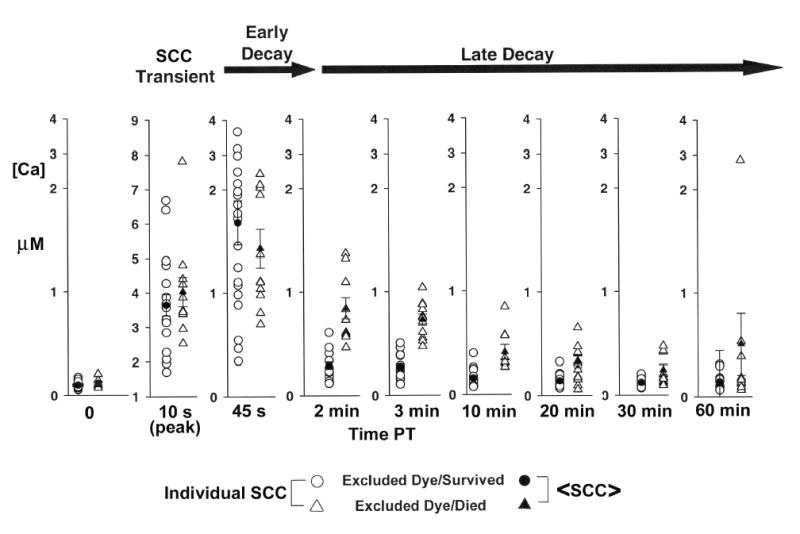
Individual somal [Ca2+] (unfilled symbols) and mean somal [Ca2+] ±SE (filled symbols) at various times (min) before and after neurite transection near the cell body for groups of B104 cells exhibiting the outcomes: (1) excluded dye at 20min PT and survived at 12h PT (circles), (2) excluded dye at 20min PT and died within 12h PT (triangles). Data are the same as in Figure 1 and were obtained as described in that legend. Note: Vertical scale change for data at 10s PT.