
Figure 4.
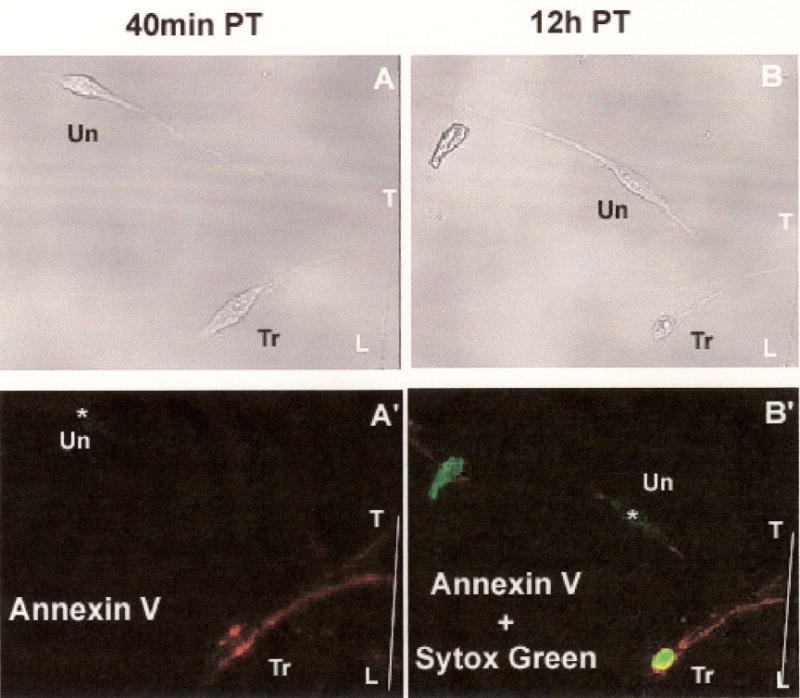
Transmission (A, B) and fluorescence (A’B’) images used to detect apoptosis with the Annexin-V-affinity assay (see Methods). Scored line in plastic culture dish labeled “T-L” marks the site of neurite transection produced by the sharp edge of the pipette tip.
(A, A’) Images of transected (“Tr”) B104 cell and a neighboring untransected (“Un”) B104 cell after incubation in control medium containing Annexin V + Sytox green at 40min PT, followed by subsequent washes with control medium lacking fluorchromes, The transected cell (A’, “Tr”) was labeled by Annexin V (Red) but not Sytox green. The untransected cell, marked as “*” (A’, “Un”), was not labeled by either Annexin V or Sytox green.
(B, B’) Images of a transected (“Tr”) B104 cell and a neighboring untransected (“Un”) B104 cell after incubation in control medium containing Annexin V-Alexa Fluor 647 + Sytox green at 12h PT, followed by subsequent washes with control medium lacking fluorchromes. The transected cell (A’, “Tr:) was labeled by Annexin V-Alexa Fluor 647 (Red) and Sytox green. The untransected cell, marked as “*” (B’, “Un”), remained unlabeled by either Annexin V-Alexa Fluor 647 or Sytox green.