
Figure 3. Cell population studies using the computer-assisted image analysis protocol.
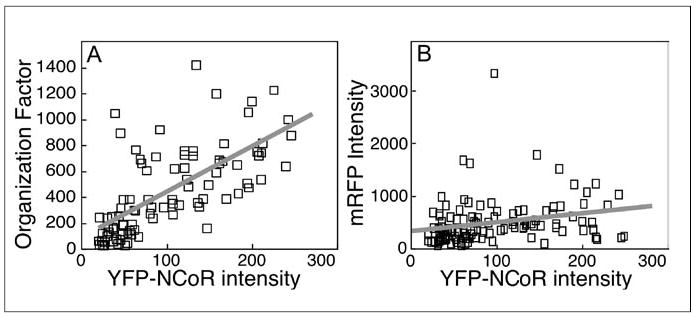
Images of over 100 cells were acquired and analyzed using an automated protocol. In the plots, each square represents data from a single cell, and a best-fit line is shown in gray. (A) The relationship for the cell population between YFP-NCoR subnuclear organization and relative YFP-NCoR expression level. (B) The relationship for the cell population between YFP-NCoR and mRFP expression levels. The R2 value (coefficient of determination) and the ANOVA F significance value estimate the correlation between the parameters, as calculated by linear regression analysis. (Adapted with permission from Reference 28). YFP, yellow fluorescent protein; NCoR, nuclear receptor corepressor protein; mRFP, monomeric variant of Discosoma sp. red fluorescent protein; ANOVA, analysis of variance.