


Figure 3.
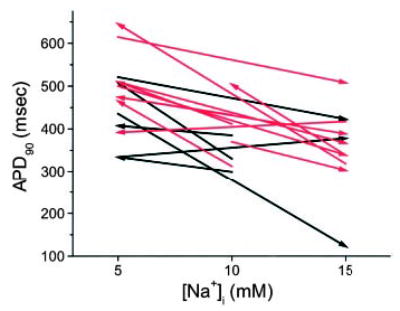
[Na+]i dependence of APD using paired pipette technique. [Na+]i was varied within individual myocytes using sequential pipettes containing different levels of [Na+]i. The direction and amplitude of the change in [Na+]i are indicated by the arrows. Black and red arrows denote myocytes from normal and failing hearts, respectively. In one cell from a normal heart and four cells from failing hearts, a third pipette was used to sequentially patch the same cell with a different [Na+]i.