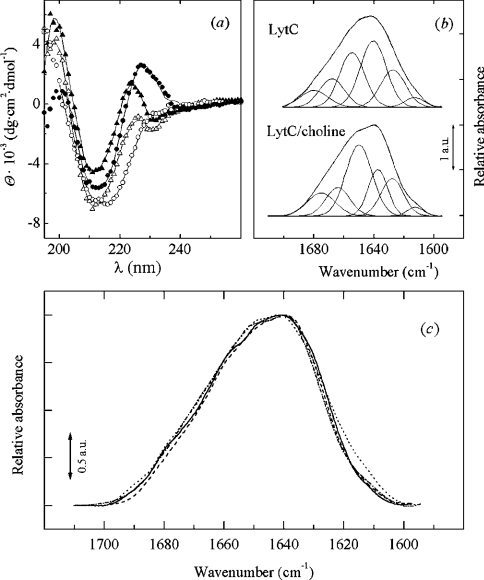
Figure 4. Spectroscopic data of LytC and Cpl-1.
(a) Far-UV CD spectra of LytC (13.4 μM; circles) and Cpl-1 (21.5 μM; triangles) lysozymes in the absence (open symbols) and in the presence (filled symbols) of 140 mM choline. Data were collected at 4 °C (LytC) and 20 °C (Cpl-1) in 20 mM phosphate buffer, pH 8.0. Solid lines are the theoretical curves calculated by CONTIN. (b) Decomposition of LytC amide I band in 2H2O. Parameters derived for the band components are shown in Table 2. (c) Amide I bands (2H2O) of LytC and Cpl-1 in arbitrary units.·····, LytC;·–·–·–, LytC–choline; ——, Cpl-1; – – –, Cpl-1–choline.

