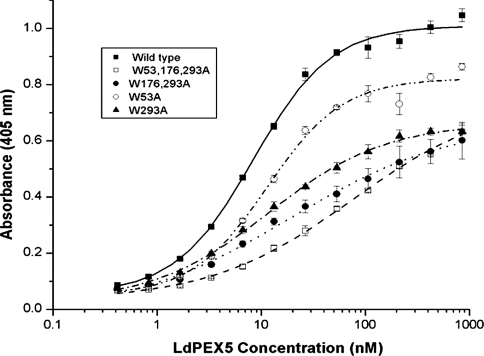
Figure 3. Determination of the LdPEX14–LdPEX5 equilibrium dissociation constant.
Microtitre plates were coated with His6/S–LdPEX14 and then incubated with increasing amounts of LdPEX5 (■), ldpex5-W53A (○), ldpex5-W293A (▲), ldpex5-W176,293A (●), or ldpex5-W53,176,293A (□). Bound LdPEX5 or ldpex5 proteins were quantified by an indirect ELISA using anti-LdPEX5 antisera. Each assay was performed in triplicate and the average absorbance values were plotted as a function of the log of the LdPEX5 or ldpex5 concentration using the ORIGIN 7.0 software. Kd values were determined as the protein concentration that gave half the maximal LdPEX5 or ldpex5 binding.

