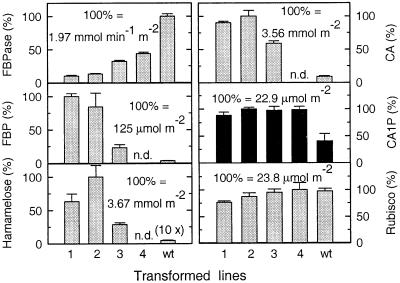
Figure 5.
Correlation between FBPase activity, FBP, hamamelose, CA, CA1P, and Rubisco catalytic sites in control and antisense plants. Amounts are expressed as a percentage of the highest value within each group. Transformed lines possessed 10% (1), 13% (2), 32% (3), and 44% (4) of the FBPase activity of the control (wt). Gray bars, light-sampled leaves; black bars, dark-sampled leaves. FBP, hamamelose, and CA were not determined (n.d.) for transformed line 4. Data represent the mean ± SD from three independent determinations.

