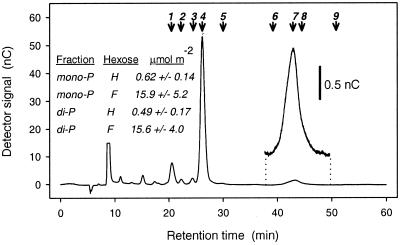
Figure 6.
Elution profile of sugars derived from a monophosphate fraction, after anion-exchange HPLC (CarboPac MA1 analytical column). The corresponding profile for the bisphosphate fraction was very similar. Numbered arrows show peak retention times of mannose (1), glucose (2), galactose (3), fructose (4), ribose (5), hamamelitol (6), hamamelose (7), sucrose (8), and sedoheptulose (9). The hamamelose peak is also shown after expansion of the ordinate axis. (Inset) The amounts of hamamelose (H) and fructose (F) determined by this procedure in the mono- and bisphosphate fractions of French bean leaves, 5 h into the photoperiod, being the mean and SD of four independent determinations.

