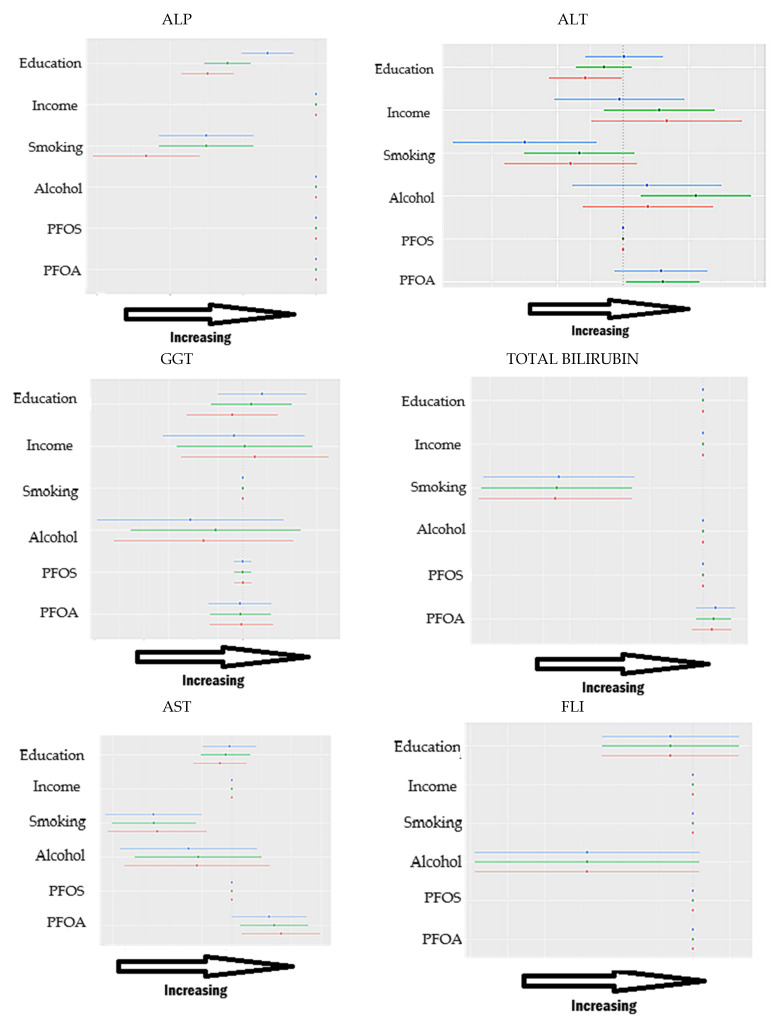
Figure 4.
Single-exposure effect of the individual exposure on liver markers; examining the change in response associated with a change in a single exposure from its 25th to 75th quantile while all other exposures are fixed at a specific quantile (25th, 50th, and 75th). In image blue is the 0.75 quantile, green is the 0.5 quantile, and red is the 0.25 quantile. Adjusted for age, race, and sex. The X-axis represents the estimated change in liver dysfunction, with estimates further to the right indicating higher dysfunction.

