
Figure 2.
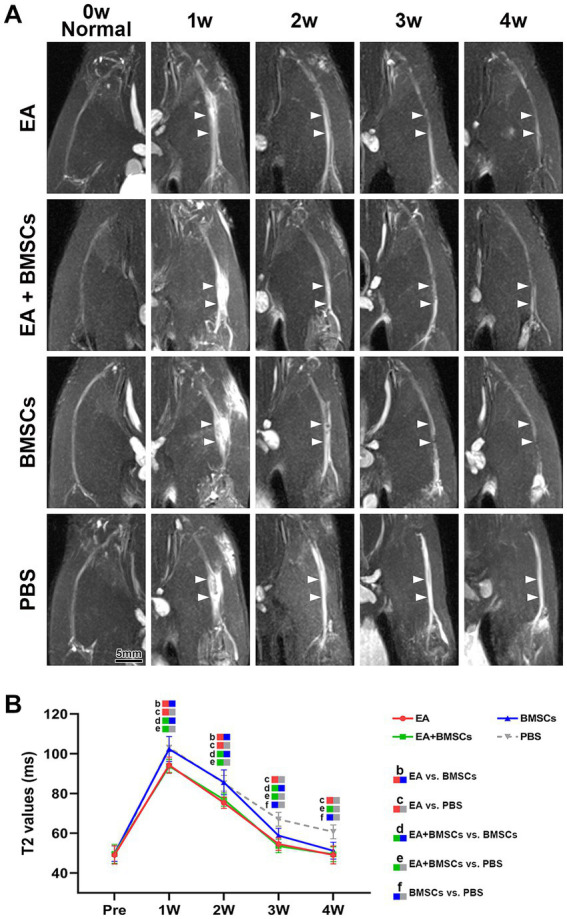
FS-T2WI of injured sciatic nerve and uninjured contralateral nerve. (A) At week 1 post-surgery, T2WI showed hyperintensity in the injured sciatic nerve across all groups due to edema, accompanied by nerve thickening and increased signal intensity. From weeks 2 to 4, nerve swelling (white arrows) and T2WI hyperintensity gradually decreased in all groups except the PBS group, returning to preoperative levels. Intergroup comparisons showed that at week 1, muscle and nerve edema were more pronounced in the BMSCs and PBS groups than in the EA and EA + BMSCs groups. By week 4, the PBS group still had mild residual edema, whereas the nerves in the other groups had largely returned to normal. (B) T2 values of the injured nerve peaked at week 1 and gradually returned to preoperative levels from weeks 2 to 4. Intergroup comparisons revealed that the EA (red) and EA + BMSCs (green) groups, both receiving electroacupuncture, consistently exhibited lower T2 values than the PBS group (gray). In the BMSCs group (blue), T2 values showed no significant difference from the PBS group in the early stages (weeks 1–2), but became lower than the PBS group at weeks 3–4. Table 2 shows the specific statistical analysis. Scale bar = 5 mm; W: week; EA, electroacupuncture; BMSCs, bone mesenchymal stem cells; PBS, phosphate-buffered saline.