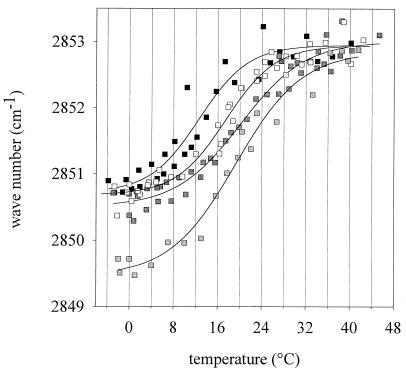
FIG. 2.
Peak maxima of FT-IR spectroscopy measurements of L. plantarum cells grown at different temperatures (TG) (solid squares, 15°C; open squares, 30°C; light shaded squares, 30°C + 5% ethanol; dark shaded squares, 37°C). Shown are the wave numbers from two independent experiments. Every experiment was done by heating the cells from −4 to 45°C and cooling them from 45 to −4°C. The curves represent the best fit of the logistic function (r2 ≥ 0.98).

