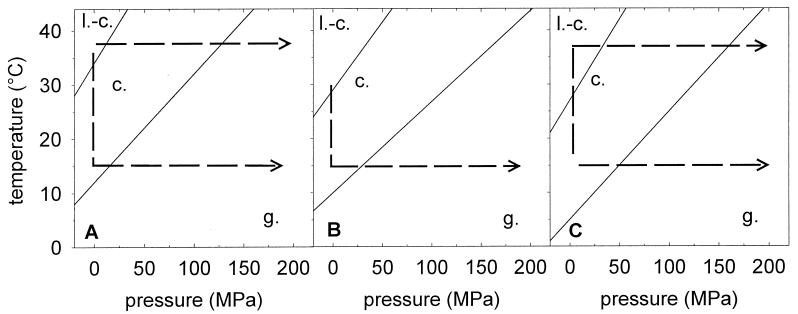
FIG. 7.
p-T diagram of the cytoplasmic membrane of L. plantarum grown at 37 (A), 30 (B), and 15°C (C). The membrane phase state in the p-T diagram is based on the data presented in Fig. 2 and 3 (FT-IR measurements from −4 to 44°C at 0.1 MPa and determination of Laurdan fluorescence spectra from 0.1 to 200 MPa at 15 and 37°C). l.-c., liquid crystalline phase; c., coexistence phase; g., gel phase. The lines represent phase transitions interpolated from the raw data. The dashed lines indicate temperature and pressure shifts during pressure treatment of cells with various growth temperatures (TG) and pressurization temperatures (TP). Cooling induces an isobar (vertical) transit to the gel region, and pressurizing induces an isotherm (horizontal) transit to the gel region in the p-T diagram.

