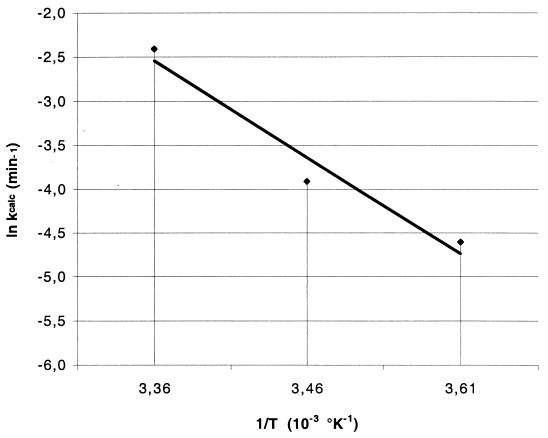
FIG. 5.
Arrhenius plot of k values versus temperature. The abscissa values correspond to the temperatures tested in Fig. 4; 3.36 corresponds to 25°C, 3.46 corresponds to 16°C, and 3.61 corresponds to 4°C. Linear regression of the data yielded an activation energy of 9.14 J/mol and a log frequency factor of 1.10 as defined by the Arrhenius equation (equation 2).

