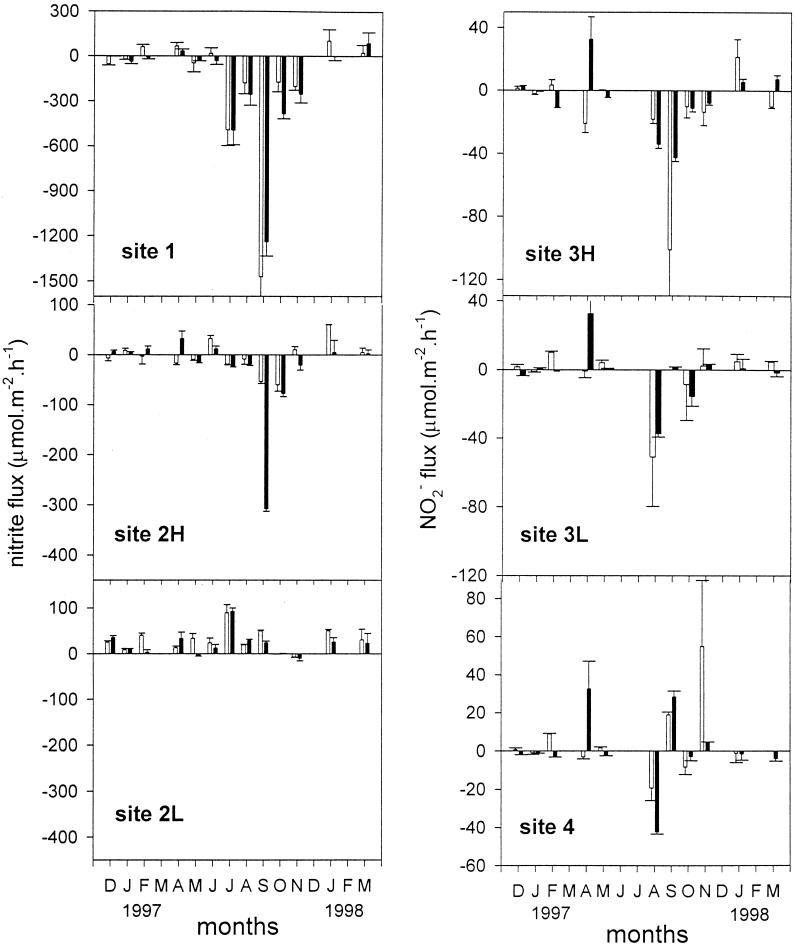
FIG. 5.
Rates of nitrite flux across sediment-water interfaces at all sites in Colne estuary from December 1996 to March 1998. The error bars indicate standard errors (n = 3). The open and solid bars represent rates measured in the light and dark, respectively. H and L denote high-shore and low-shore stations.

