
Fig. 4.
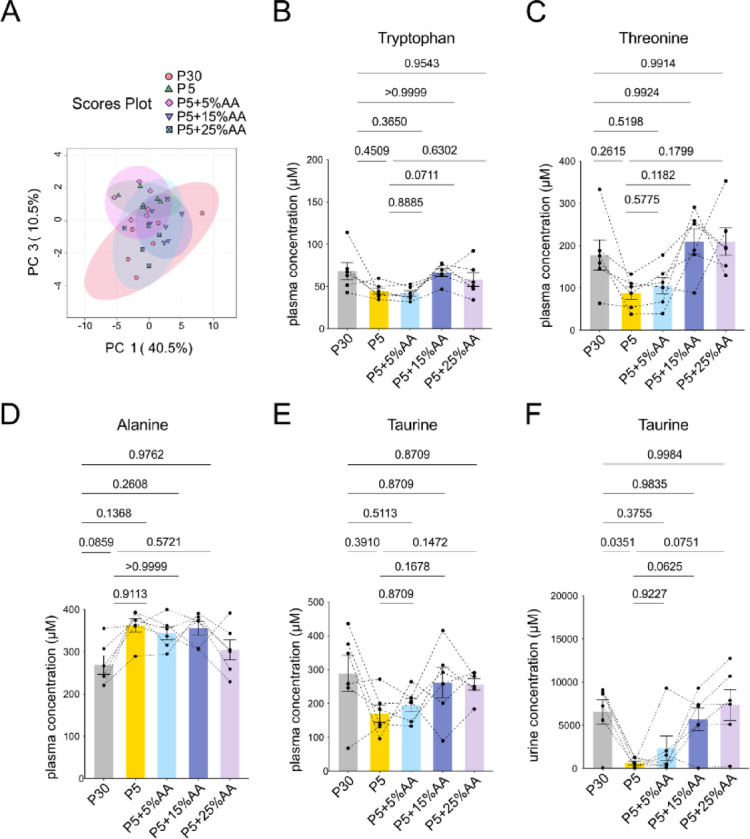
Amino acid supplementation can ameliorate the metabolite profile of low protein diet. (A) Principal component analysis of plasma metabolites in male marmosets quantified using LC-MS/MS. (B-D) Quantification of plasma tryptophan (B), threonine (C), alanine (D). (E-F) Quantification of taurine concentration in plasma (E) and urine (F). For (B-F), statistical analysis was performed by repeated measures one-way analysis of variance (ANOVA). The p values determined by post hoc analysis with Šídák’s multiple comparison test are shown in the figure. All data are presented as mean ± s.e.m.