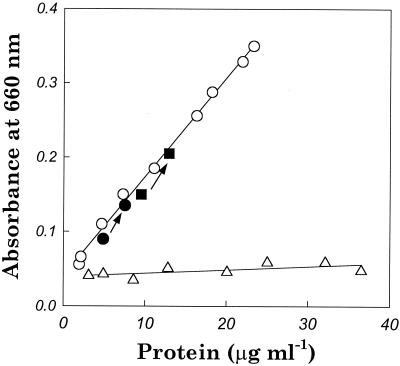
FIG. 5.
Growth of M. jannaschii in a hydrostatic bioreactor at 260 atm (•, ▪) and in the hyperbaric bioreactor at 7.8 atm (○) and 260 atm (▵). OD660s (after a 1-s decompression) and protein concentrations for growth in the hyperbaric bioreactor were correlated by linear regression. Arrows indicate cell growth for 10 h in the hydrostatic bioreactor starting from two different cell densities. The initial cell densities are indicated by the lower solid symbols.

