
Figure 5. KrasG12D Trp53KO lung cancer induces kidney fibrosis in a manner dependent on its metastatic potential.
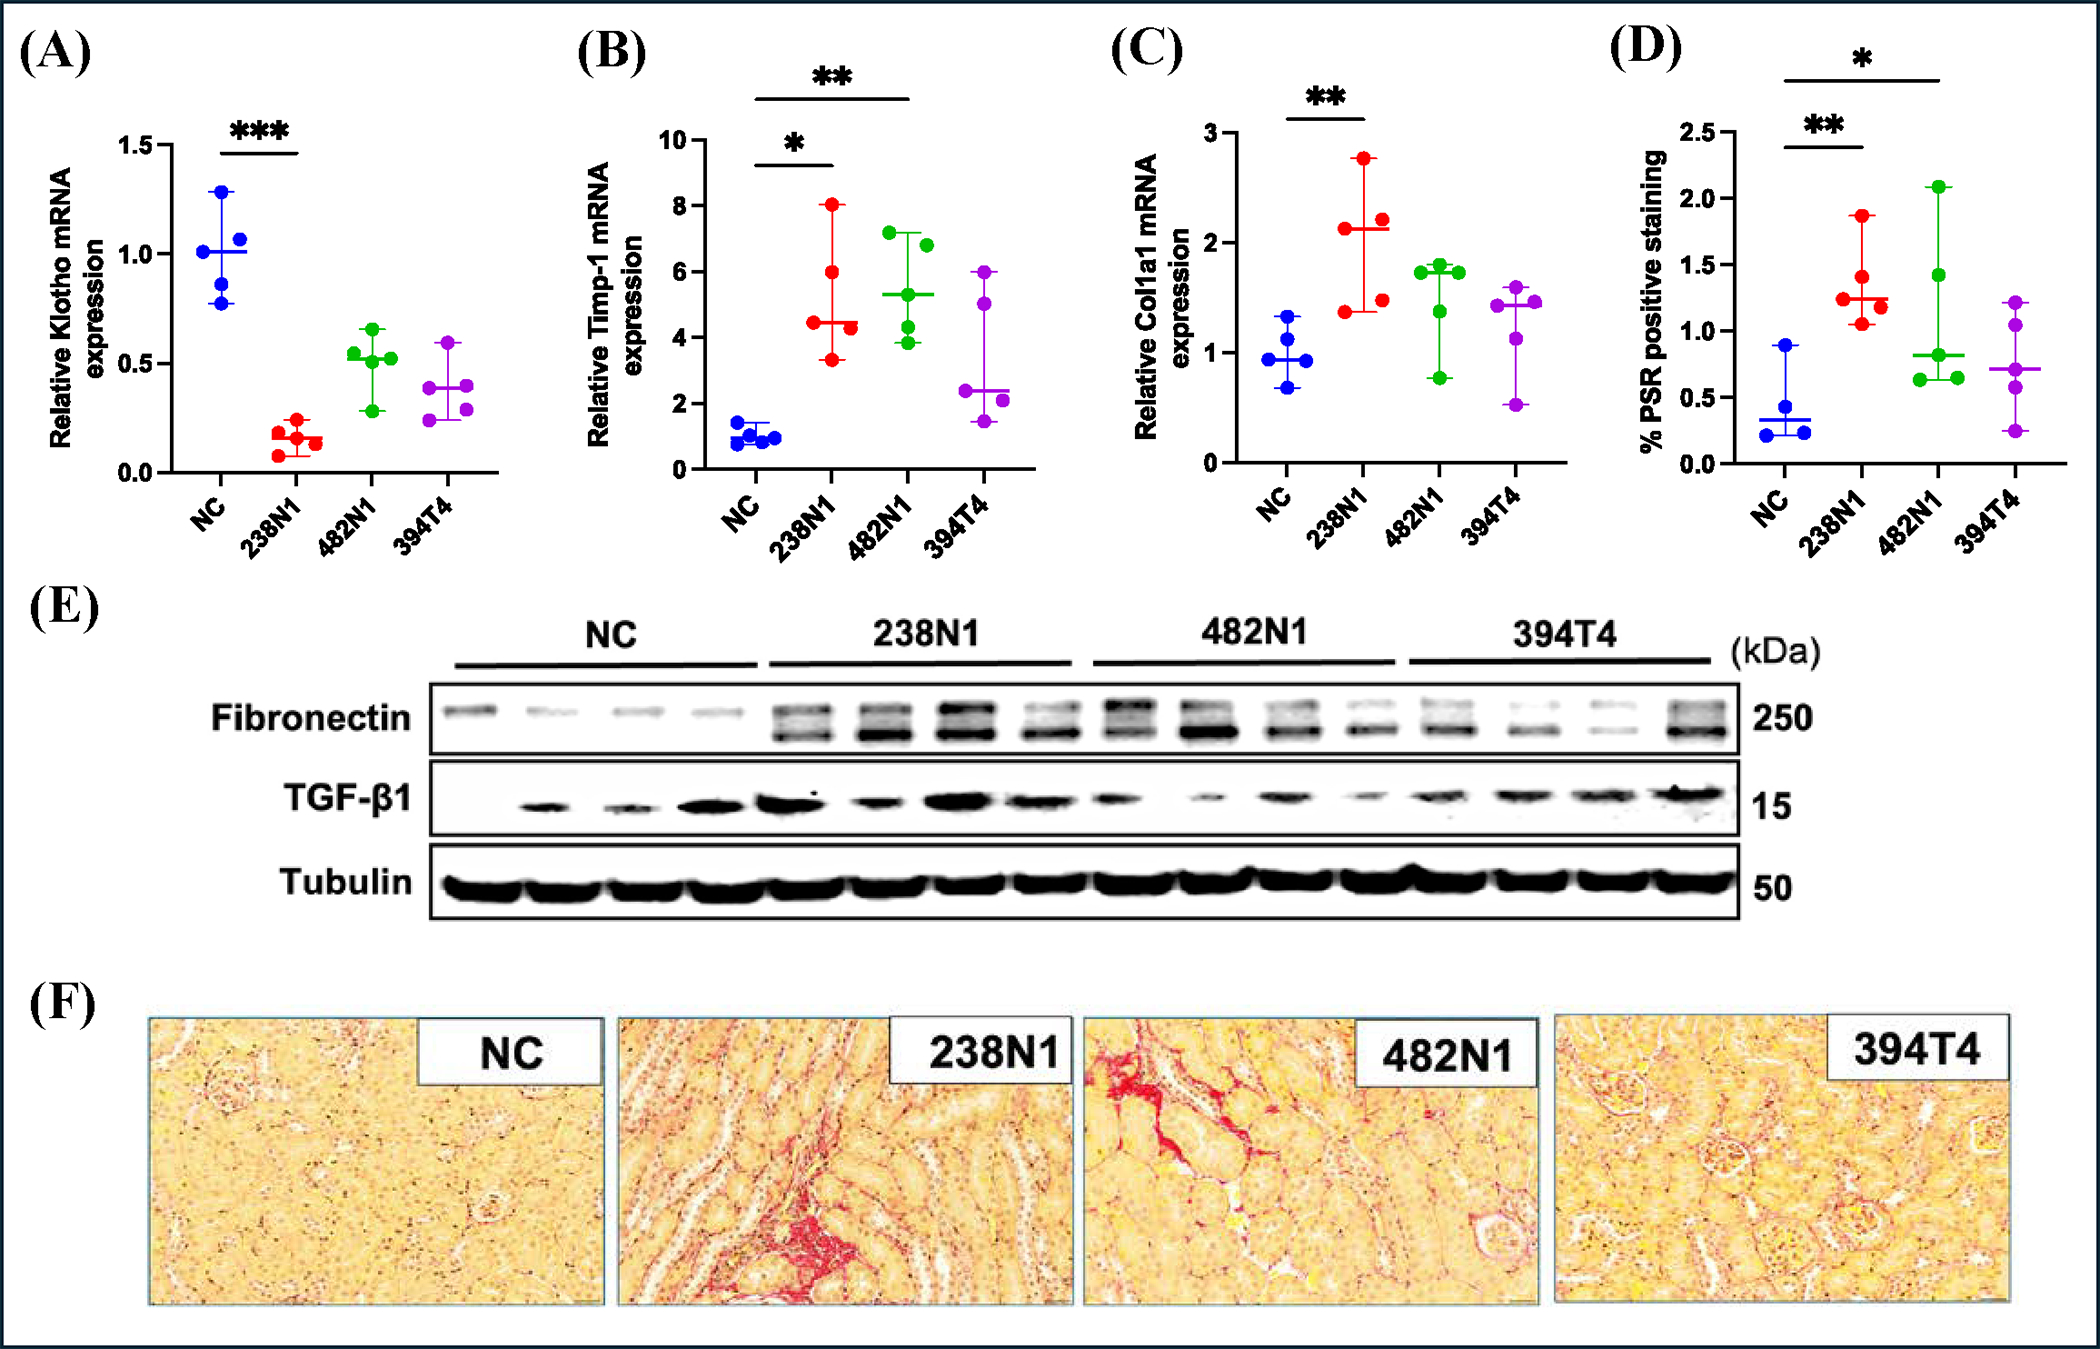
(A) Scatter plots of relative mRNA level of Klotho, (B) Timp-1 and (C) Col1a1 in mice with or without cancer. (D) Quantification of PSR positive staining of the kidney sections. (E) Western blot analysis. (F) Representative images of PSR staining. Scale size: 20 μm. Data are presented as mean ± SD or median ± range. *P < 0.05, **p<0.01, ***p<0.001, based on one-way ANOVA or Kruskal-Wallis’s test. Non-Cancer (NC).