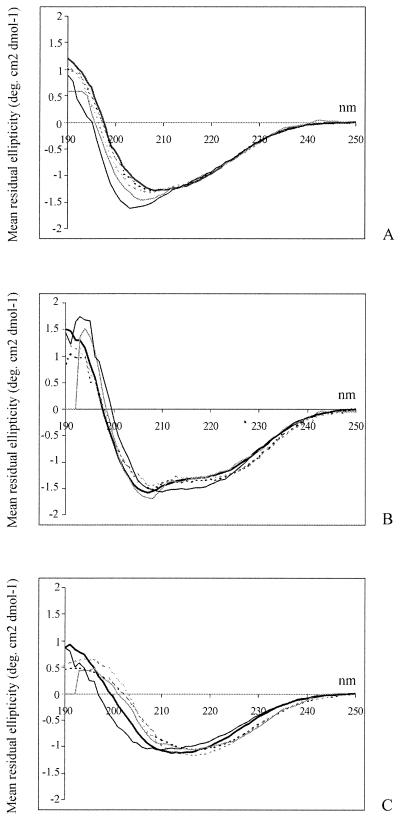
FIG. 4.
CD spectra of SC3 and its derivatives. (A) Spectra of SC3 and its derivatives in the monomeric form. (B) Same as panel A but assembled at the water-Teflon interface. (C) Same as panel A but assembled at the water-air interface. SC3 is indicated by a thick black line; RGD-SC3 is indicated by a thin, broken black line; TrSC3 is indicated by a thin gray line; RGD-SC3 is indicated by a thin, broken gray line; and deglycosylated SC3 is indicated by a thin black line.

