


Figure 2. Neurons are the major contributors to de novo neurosteroid biosynthesis.
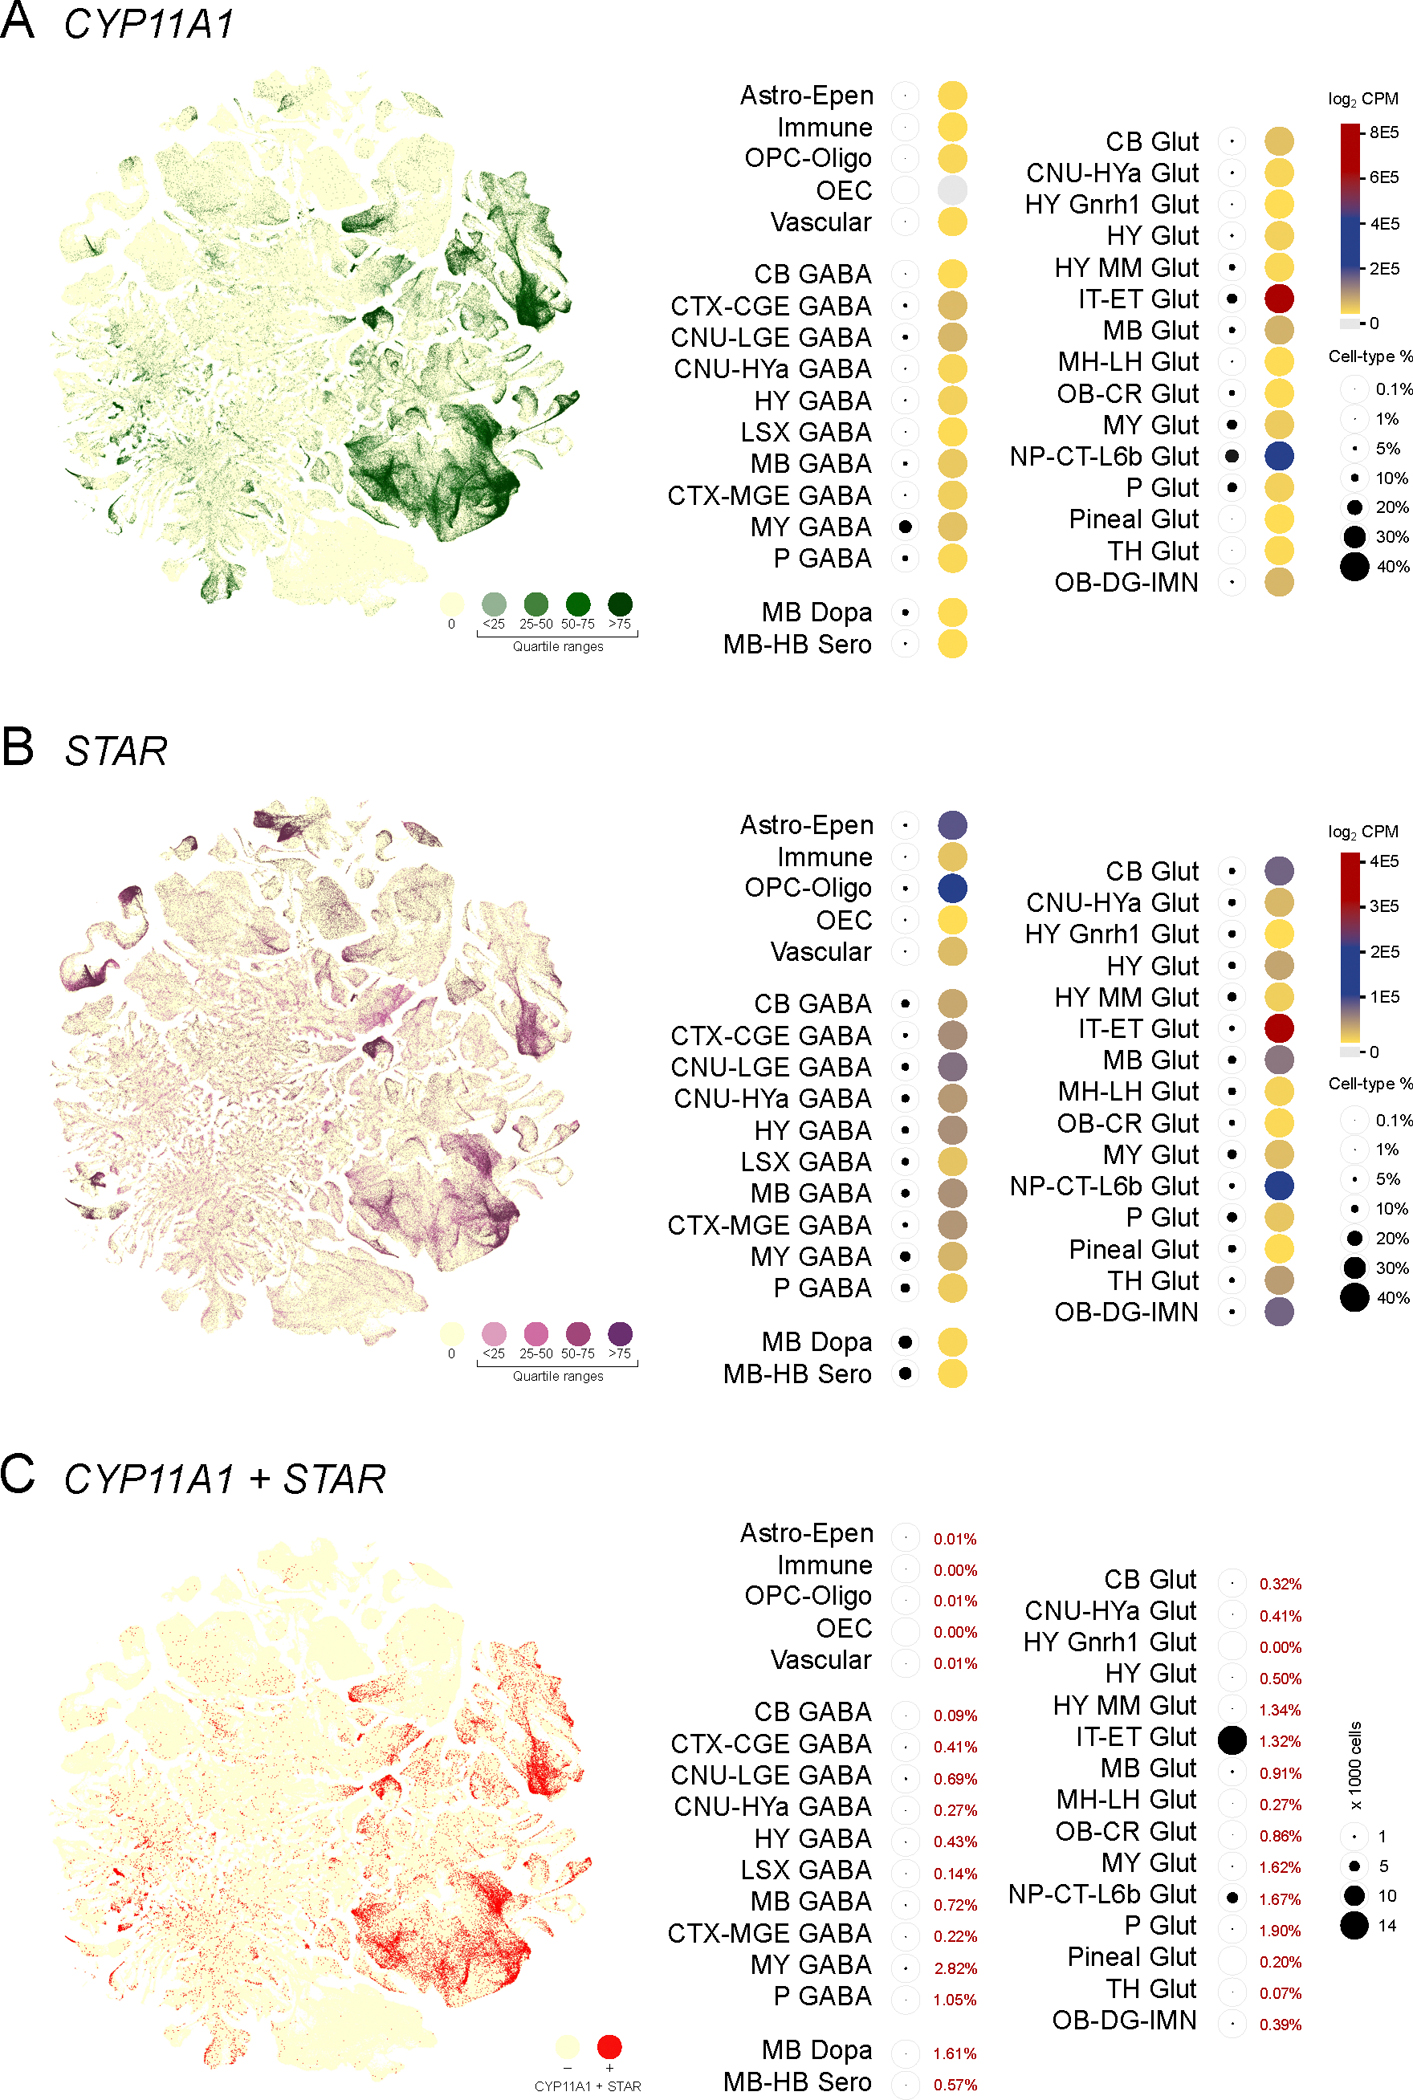
(A) Expression of Cyp11a1 from single cells visualized in a cell type defined t-SNE plot with colors that indicate zero and positives (as four quartile ranges). Valuation of regional and cell type specific Cyp11a1 expression (heatmap with total expression log2CPM) and percentage of cell type-specific expression as indicators of pregnenolone production indicates that majority of de novo neurosteroidogenesis occurs in different types of glutamatergic and GABAergic neurons. The glutamatergic IT-ET neurons showed the highest levels of Cyp11a1 expression, followed by NP-CT-L6b neurons. (B) Expression of Star from single cells visualized in a cell type defined t-SNE plot (color range indicates quartiles) and heatmap. Valuation of regional and cell type specific Star as an essential step in steroidogenesis indicates a pattern inconsistent with Cyp11a1, encompassing both neuronal and non-neuronal cells. (C) A t-SNE plot visualizing co-expression of Cyp11a1 and Star (Red), highlights the frequency of co-expression correlated to the different neuronal cell populations.