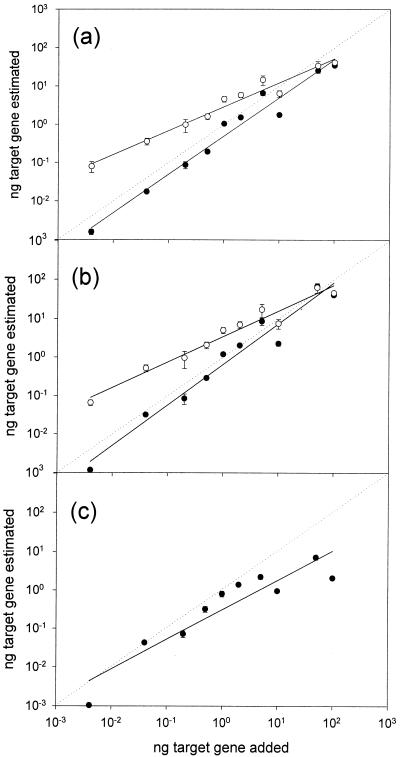
FIG. 3.
Relationship between estimated model gene concentration and actual concentration of model genes, nirS (a), nahA (b), and E. coli O157 O-antigen biosynthesis gene (c). Closed circle, calculated by log (R′) = α log (fx/fλ) + β, in this study; open circle, estimation by hybridization kinetics. The solid line indicates the regression curve, and the diagonal dotted line indicates a 1:1 relationship. Error bars indicate standard deviations. No error bars are shown when smaller than symbols.

